Analysing Network Visualization Statistics

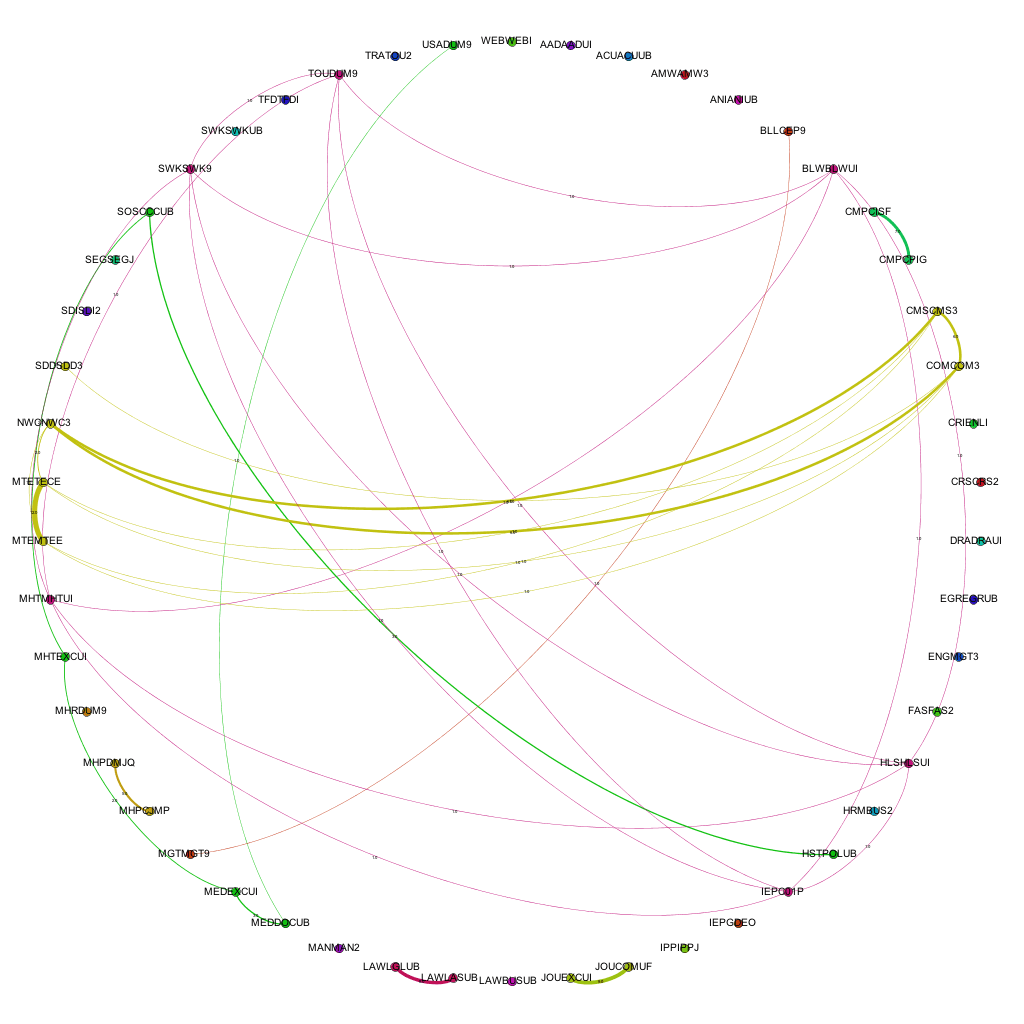
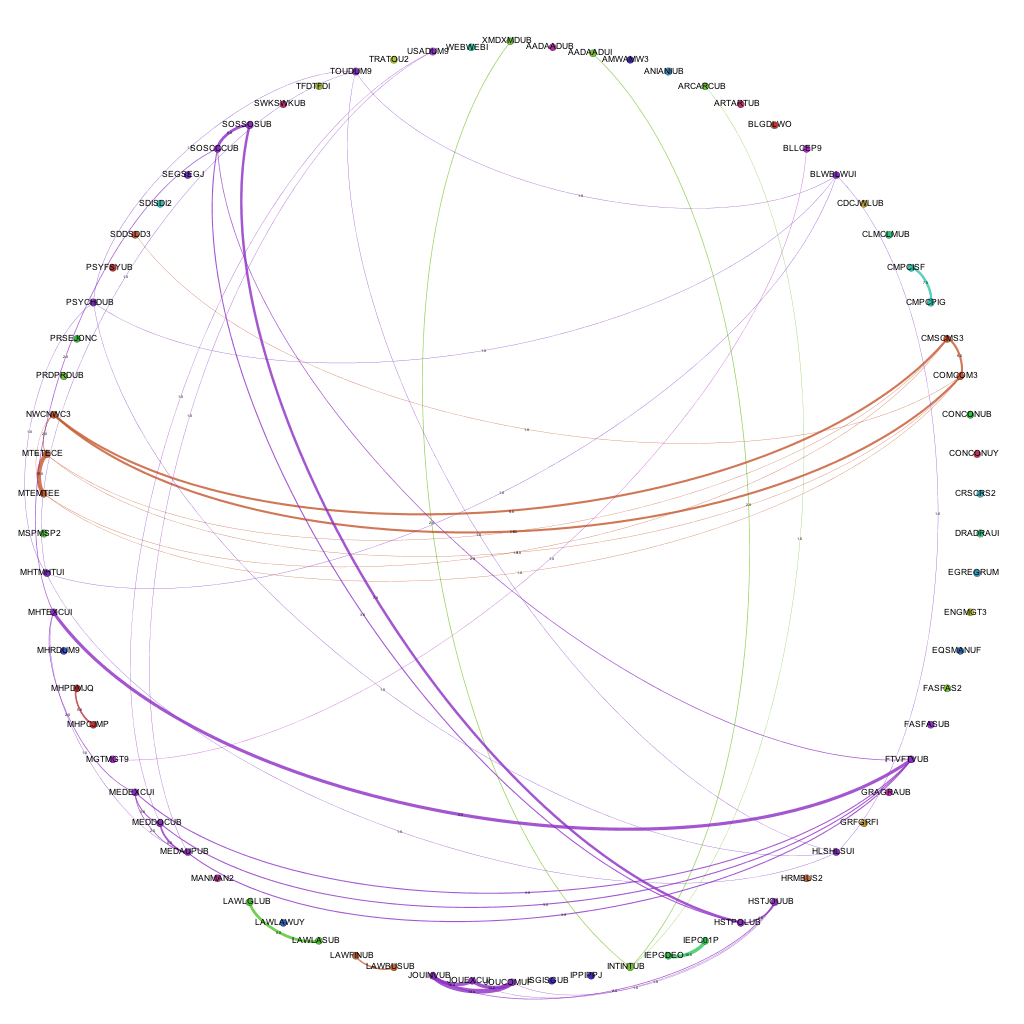
As mentioned in a previous post, there are many statistics that can be derived from the network visualizations that I have been generating from the course data I have been collecting. At the moment, these are the particular numbers that I have been paying attention to:

  • Mean Degree of Nodes – The mean amount of connections per node on the graph.
  • Mean Weighted Degree of Nodes – The mean weight of connections per node on the graph.
  • Graph Density – A ratio of the number of edges per node to the number of possible edges.
  • Modularity – a measure of the strength of division of a network into modules. Networks with high modularity have dense connections between the nodes within modules but sparse connections between nodes in different modules.
  • Mean Clustering Coefficient – the degree to which nodes in the graph tend to cluster together.

So, in terms of applying these to the networks generated with awards data:

  • Mean Degree of Nodes – The mean amount of connections for each award. i.e. the mean amount of awards that each award is connected to.
  • Mean Weighted Degree of Nodes – The mean weight of connections for each award. i.e. the mean amount of modules shared by that award with other awards.
  • Graph Density – The amount of connections per award when compared to the total amount of awards in the network. (more affected by an increase in awards offered than others)
  • Modularity – a higher modularity suggests that awards are very highly connected with specific other awards, but have very few ‘odd’ connections to other awards in the network. A very high modularity would suggest that a group of awards shared a lot of modules between themselves.
  • Mean Clustering Coefficient – a low coefficient would suggest that awards did not group together, and therefore did not share modules between them. A high coefficient would suggest that most of the awards in the network formed clusters with other awards.

The numbers generated for the weighted connections between awards for the academic year 2006/07 through to 2012/13 are as follows:

Academic Year Mean Degree Mean Weighted Degree Graph Density Modularity Mean Clustering Coefficient
2006 – 2007 0.804 1.821 0.069 0.657 0.357
2007 – 2008 0.763 1.711 0.041 0.726 0.408
2008 – 2009 0.500 1.324 0.030 0.588 0.224
2009 – 2010 0.405 1.432 0.023 0.574 0.124
2010 – 2011 0.720 1.880 0.029 0.777 0.212
2011 – 2012 0.716 2.486 0.020 0.810 0.259
2012 – 2013 0.651 4.349 0.021 0.847 0.267

So what do these numbers show and are they actually useful? Well….

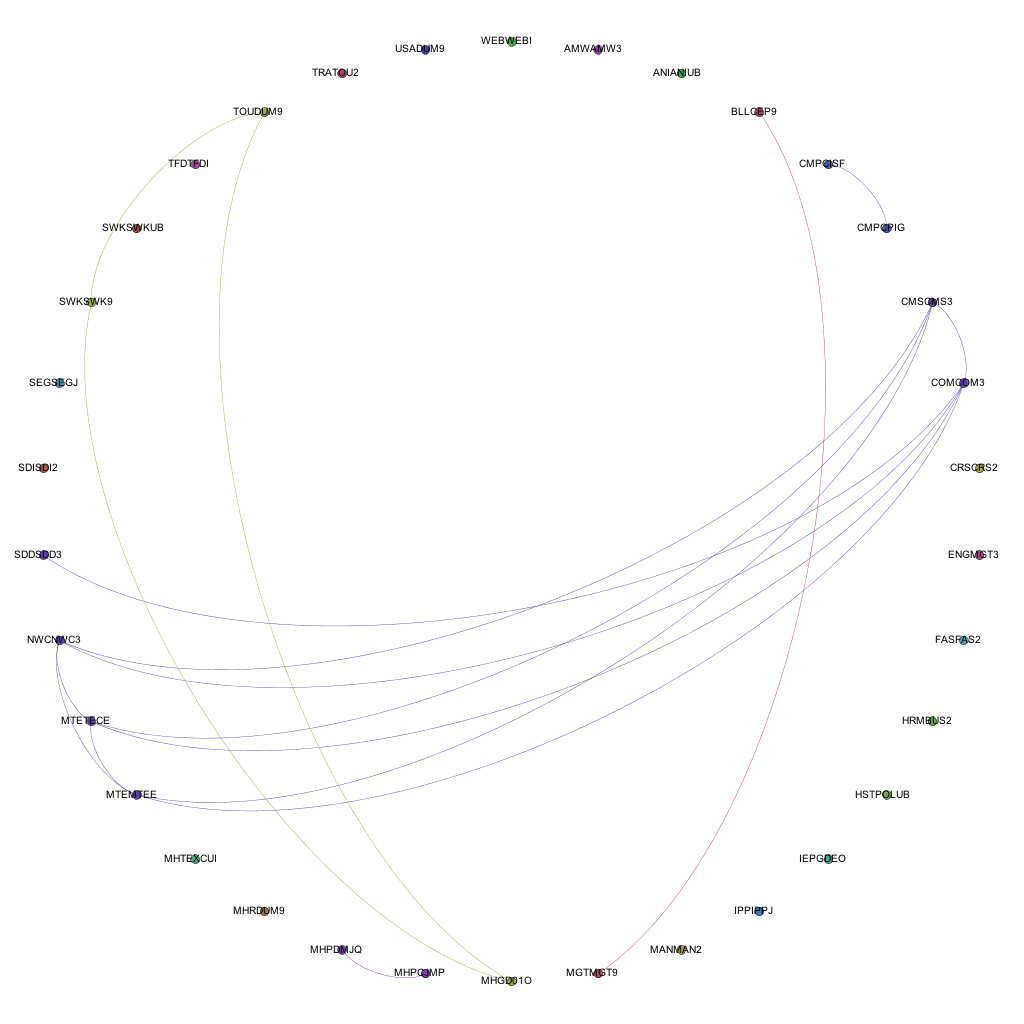
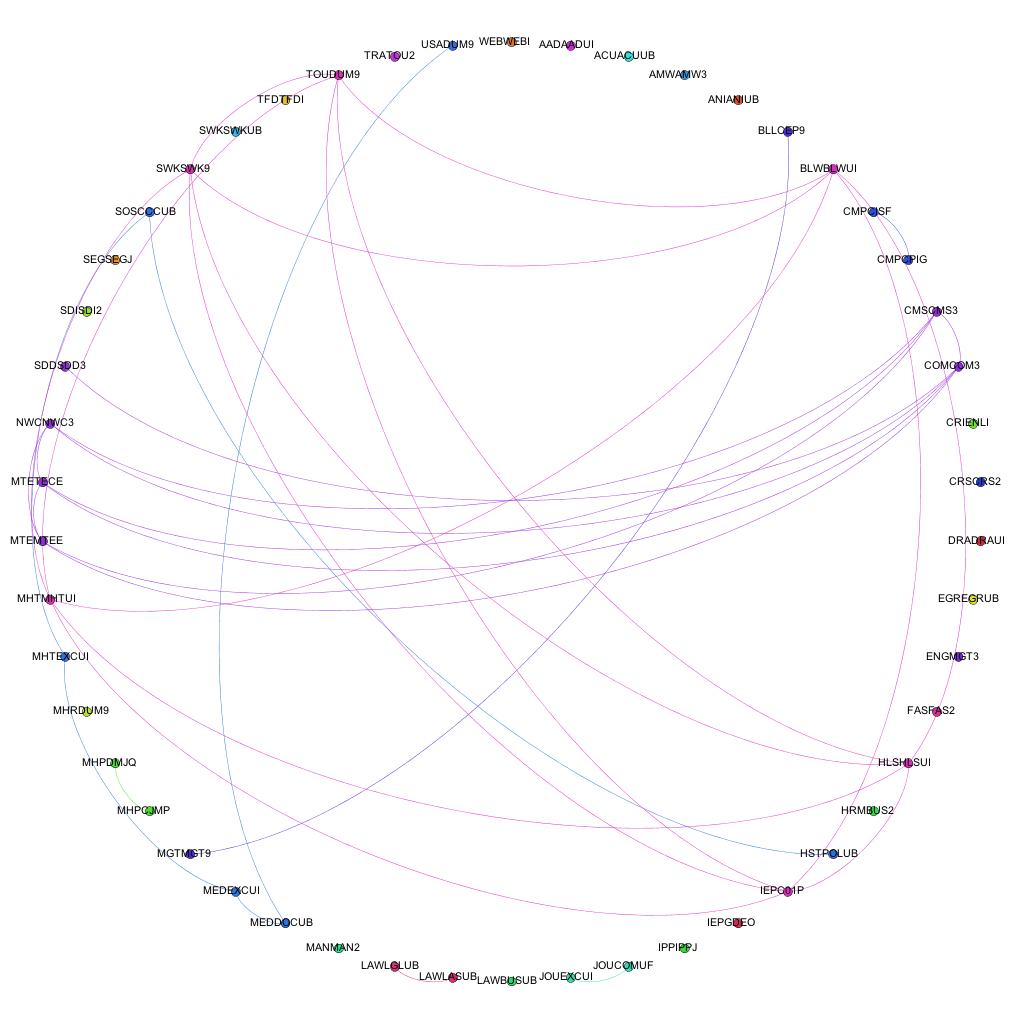
Mean degree shows the amount of awards that each award is connected to, on average. If we look at mean weighted degree instead, we then take into consideration the weight of a connection between a pair of nodes, i.e. the amount of joins between them, rather than just the fact that a join exists. Plotting this graphically helps to show the pattern that emerges.


Mean weighted degree of awards, 2006/07 - 2012/13

From the graph above it becomes clear that there is a definite drop on MWD (mean weighted degree) from the academic year 07/08 to the year 08/09 (around 22%), showing that the average amount of links between awards dropped fairly considerably. Through looking back at the university’s history, this can be explained as this was the point in time that the amount of points per module of study was altered, meaning that, essentially, multiple version of the same award were running in tandem: some with the old weighting of awards, some the new. This also explains the steady increase in MWD up to 11-12 which is the first year that the old weighted degrees would not have been active at all. From the highest point of the old weighting, to this point in the new weighting, there is an increase of over 36% in the amount of joins between awards offered at the university. This shows that (assuming an increased modularity is good in terms of curriculum design) that the provision has been improved through the alteration of module weightings. Taking into account the overall increase in the amount of awards offered, this also shows that the restructuring of the modules had a significant impact on the sharing of teaching and assessment across different awards.

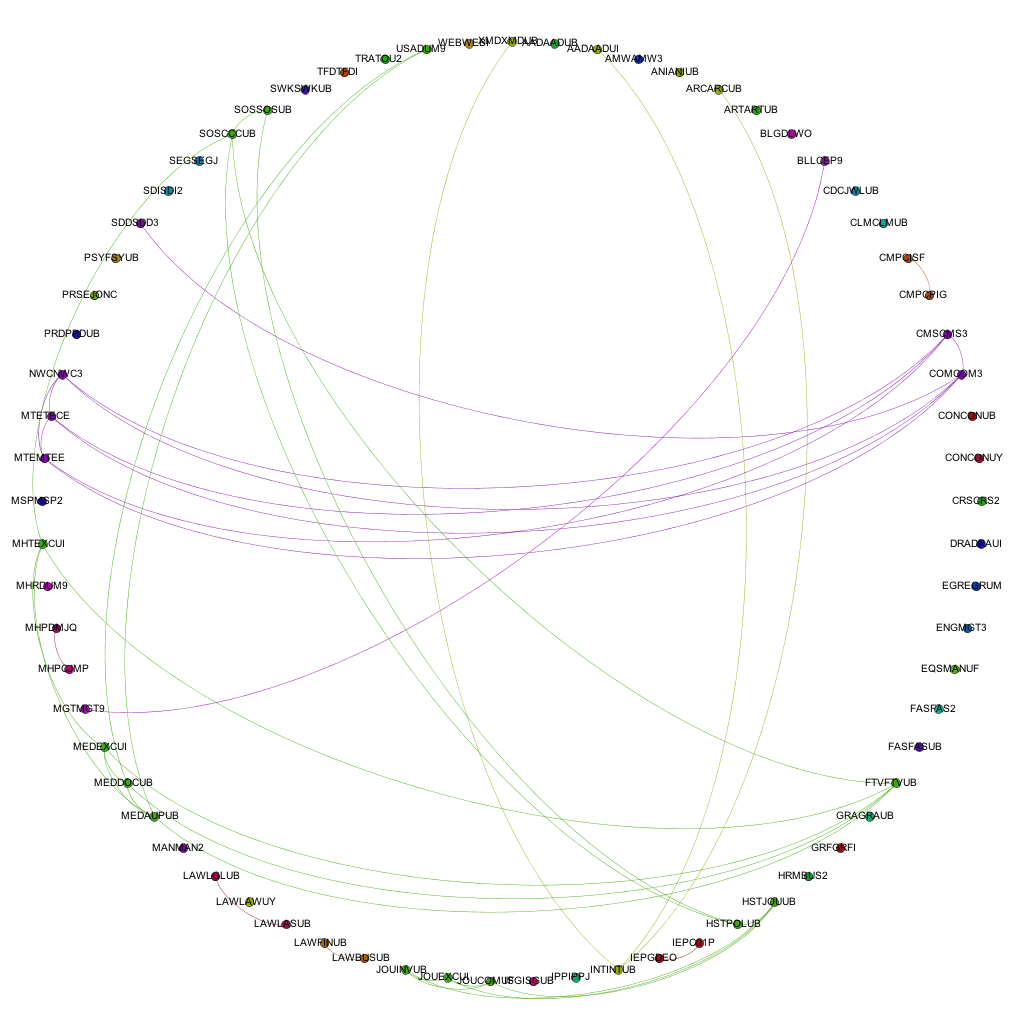
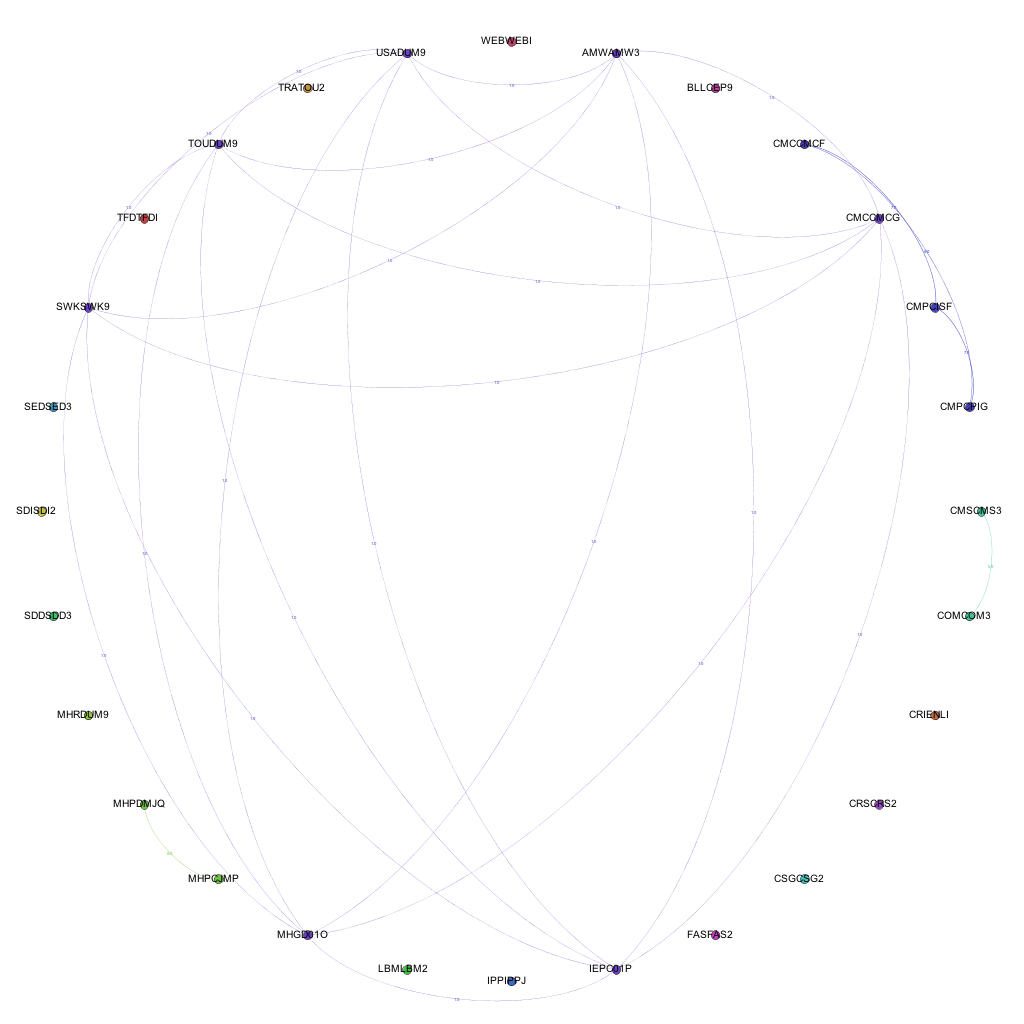
The number given for the ‘modularity’ of the graphs shows a couple of interesting things.

Modularity values for awards, 06-07 to 12-13

As noted above, the modularity shows how well the nodes on the graph (i.e. the awards) form into self contained clusters. A value of 1 would suggest that the awards form perfectly into self-contained clusters, having lots of connections between themselves but no connections with other clusters, a value of 0 would suggest the opposite. As you can see from the graph above, in 06/07, the modularity was reasonably high, quite possibly due to the smaller amount of awards offered at the university. This figure rises over the next year, and then drops for two consecutive years as the weighting of modules at the university goes through a period of change. As the change is fully implemented, the modularity rises significantly and continues to rise, almost at a constant rate from 2010-11 through to 2012-13. This would suggest (though is not necessarily the case) that, either by design or good fortune, the awards offered at the university are starting to form into self-contained groups or areas of specialism. This is interesting to note, as the university has recently gone through an organizational restructuring whereby three colleges were formed – could these clusters be contained within the colleges?

Though this has only looked at two series of numbers generated for each of these visualizations, it does show that visualizing course data produces extra data that cannot be collected when the data is in its raw form. Further to this, it also shows that this data accurately reflects historical changes in provision within the university. If these principles can be applied retrospectively to show changes, in which ways can they be applied to decision making processes, to help assess the impact of potential changes?

Dev8eD and the XCRI Course Aggregator

On the 29th and 30th of May I attended the dev8eD conference in Birmingham, which was organized for ” …developers, educational technologists and users working throughout education on the development of tools, widgets, apps and resources aimed at staff in education and enhancing the student learning experience.”

There was several organised sessions that were of direct relevance to the ON Course project, including sessions on XCRI-CAP and the XCRI-CAP Aggregator currently being developed.

One of the challenges at dev8eD was to make use of the data available through the XCRI-CAP Aggregator and present it in useful / meaningful / interesting ways; with some help from Dale Mckeown who also works the University of Lincoln, I created a mashup of data from multiple sources to make a rudimentary course search engine.

The mashup uses data from the course aggregator (currently searching only by keywords) with geo-location data, university league table data and pub location data. The course finder also links to local crime data for institutions and ‘cost of living’ data. These latter two data sources were used to show how external data sets can be used to enrich the searching experience, providing further context for the wider surroundings and environment of universities.

When more XCRI feeds are added to the aggregator, the quality and quantity of data available through the aggregator’s API will obviously increase, meaning that such a search engine would become more useful. In its current state, the website acts as a good prototype for search functionality, and also demonstrates the potential for ‘mashing up’ XCRI data with numerous other datasets.

The code (such as it is) for the website is available on Github.

Back to Visualizing Course Data!

After having worked on creating a badge system for universities over the past few weeks, I’ve now gone back to looking at how the massive amount of course data that I currently have can be visualized in a meaningful and useful way.

My first bout of visualization resulted in a series of A0 posters showing the links between all of the modules currently being delivered at the university. Whilst these visualizations are very useful for showing the complexity of course structure and relationships, it becomes fairly difficult to extract any information that is particularly useful. For example, the edges in the network denote a connection between two modules in terms of the award that the combination is delivered on. A collection of edges of the same colour show a group of connections for the same award, i.e. a group of modules delivered as part of one particular award.

As the next step in my on-going quest to make sense of all of this course data (and related datasets), I’ve decided to look at a different abstraction of the same datasets, this time looking at the connections on an award level. This is one level of abstraction higher on the scale of University -> College -> Faculty -> School -> Award -> Module. By changing to this level of abstraction, it means that a) there are far fewer nodes on the graph, making it easier to see the information and b) it is easier for people to relate to an award (i.e. more easily recognizable what the node is referring to) than it is at a module level. At the moment, the visualizations are considering data for awards that are ‘Active’ i.e. have students on all levels and have a full-time, ‘traditional’ degree ‘feel’. I chose to do this as taking into account awards that are on their way in or way out, and part-time variations on a theme offered in a full-time course started to distort the data, flooding the networks with nodes and edges that are essentially replicas of other nodes and edges in the graph. Obviously the visualization exercise could be repeated for part-time or post-graduate courses, or to include them.

Narrowing the data down as described above, and running it through the trusted Gephi, this time using a circular layout algorithm, produces visualizations such as the following:

Links between awards for 2006-07


Links between awards for 2009 - 10
Links between awards for 2012 - 13

Each node around the edge of the graph represents an award that was active at the university for that particular year. With the university being relatively young in the grand scheme of things, the time-span between the first visualization (06-07) and the final (12-13) represent a substantial proportion of the university’s (in its current form) history. Award codes have been used as they are fairly short and remain similar in groups of awards offered by the same departments or schools. By doing so, the relative position of awards is more or less maintained in each visualization. For example. the pattern created between Computer Science awards and Media awards exists and can be easily spotted in each of the visualizations, even though the amount of awards in each visualization changes and the exact award codes of each award code may change. The full collection of visualizations can be accessed here: 2006 – 2007, 2007-2008, 2008-2009, 2009-2010, 2010-2011, 2011-2012, 2012-2013. These visualizations show three different sets of information: the amount of active awards for each year, the codes for the active awards and the relationships (where they exist) between the awards, i.e. where they share modules in common.

By taking into account the amount of modules shared between the awards and including this in the visualizations, we get a different view of the data. We can not only see where links exist, but also the strength of the links between the awards. Including the amount of modules shared between awards as the weight of each of the edges produces the following visualizations:

Weighted joins between awards 2007-08
Weighted joins between awards 2009-10
Weighted joins between awards 2012-13

The full collection of these visualizations can be found here: 2006-07, 2007-08, 2008-09, 2009-10, 2010-11, 2011-12, 2012-13

By introducing the weighted edges into the network, we can learn new pieces of information through the visualizations. Whilst the Computer Science – Media pattern exists across several years, we can see it move from being one of the more dominant links (2007-08 / 09-10) to being overshadowed by the amount of modules being shared by, for instance, Film and Television and Media Production and History & Social Science awards.

As well as making pretty pictures with the course data, the statistics associated with these networks can also be analyzed, but that will be the focus for my next blog post.


Release the Badges!

After working on the badges system that I outlined in a previous post, it has finally reached a point where it is functional enough to be ‘released’. It should be noted, though, that it is neither fully functional ‘out of the box’ and is by no means a shining example of development practices at their best. The mini-project of looking at how a system such as the Mozilla Open Badges platform could be used in higher education has suffered tremendously from scope creep and the underlying code (at the moment) reflects this. Over the past few weeks I’ve been through the following phases:

  • Consider how Open Badges (or similar) could be used in higher education.
  • Create a prototype system to be used in higher education.
  • Develop a more stable system that could be used in a trial run within our university.
  • Develop the system in such a way that it could be picked up and used in a variety of institutions or situations with minimal reconfiguration.

Initially, I considered creating a small database to hold ‘objectives’ that need to be met in order to be awarded badges, along with the bare minimum of APIs in order to interact with the database and the Open Badges framework. After starting out down this path, I started to realise that there was far more potential in a badging system within a higher education institution than I had originally thought and began to think of more features that would be useful.

At this point, I started to develop an application rather than a group of APIs that would provide a far more usable method of managing badges and associated data. After discussions with others around the university and on the open badges mailing lists it seemed that there was potential to use badges (or something similar) to recognise skills developed at university, as well as extra-curricular activities that may form part of the HEAR (Higher Education Achievement Report) or similar. This led to me considering the reuse of any system I developed in other institutions, which altered the way I implemented a few features in the system.

In its current state, the application allows you to login via 2 alternative methods: local registration or via oAuth (which we use at the University of Lincoln). Obviously the oAuth settings would need altering if you were to implement it in this manner in your own institution. Once logged in, admin users (who currently need the admin flag setting manually in the database) are able to create badges, objectives for badges, create a source of badges (could be different departments within an institution) and mark objectives as being complete for a given user or set of users (the application calculates if users are then eligible for the awarding of a badge). When logged in as a ‘standard’ user (although admins can earn badges, too) you are able to see your badge ‘profile’, which shows badges that have been earned and are ready to be claimed, badges that are partially complete (i.e. you have met 1 of 2 objectives for the badge) and badges that have been completed and claimed by you.

Badges that are ready to be claimed can be sent to a backpack (currently beta.openbadges.org) or downloaded as an image, so that they can then be uploaded to another backpack. Badges that have already been sent to a backpack can also be downloaded as images, thus allowing you to add the badge to another backpack if you so wish.

There are still a few features that need to be added to the application and known bugs that need fixing, such as:

  • Feature allowing password reset needs completing
  • The ability for admin users to grant other users administrative privileges
  • A ‘single use’, first-run admin login, thus allowing the initial user to grant admin privileges to somebody. When combined with the previous point this will remove the need for users to manually edit records in the database.
  • There is a known bug with marking objectives as complete for a user ID that has yet to login to the system. Assuming the unique ID of a user is known (currently envisaged as being the staff or student number), objectives can be marked as complete for that user. If the user is eligible for a badge due to the completion of the correct objectives before logging in, the badge currently gets stuck in limbo, as it cannot be awarded as the application does not have the users email address. A simple fix would be to have a “I think i’ve earned this badge” button on the partially completed badges section of the user’s profile.
  • Functions within the code itself need tidying up, because of the amount of scope creep there is likely to be a few functions that are no longer used etc.
  • The user interface needs working on. At the moment ‘it works’.

Here are a few screenshots of the application:

Homepage
Secure sign on using University of Lincoln oAuth
Badge Profile Screen
Claiming a Badge

The code for the application is available on Github and is released under the GNU Affero General Public License, documentation for the application (such as it is) is also available on Github – I’ll be working on the documentation over the next couple of days. At present there are two branches to the repository: master and develop. The master branch *should* remain stable, while the develop branch will be used to implement the features, and fix the bugs, discussed earlier.

Now that the application is reasonably stable, we’re starting to think of ways that we could trial the application. At the moment it looks like a couple of potential ways are to mimic what may appear in people’s HEAR reports for extra-curricular commitments etc, or perhaps recognizing skills that are developed and presented in non-assessed environments, such as workshops that help develop practical skills etc. However, with the end of the student year fast approaching, it is more likely that I will continue to tinker with and improve elements of the system before trialing it in some form or another from September onwards, with the return of the students.

Designing a Badge System for Universities

Over the past week or so we have started looking at the Mozilla Open Badge platform and how it could, possibly, be applied to use within HEIs (and beyond). It started to become apparent, through reading other peoples blog posts and reading through mailing lists, that there is already some work going on to award badges for completion of modules of study or achieving particular learning outcomes. After looking at what information is required to award a badge using the Open Badge framework, I created a design for a platform that can be picked up and used within another institution or context with minimal customisation required. The purpose of this blog post is to document the decision processes involved and to describe and show the resulting design.

The Basics

The basic premise of the system is fairly simple: create badges and award them to individuals who meet the criteria for each badge. These awarded badges can be ‘baked’ (to include the relevant information) and sent to individual’s ‘backpacks’ – be that the OpenBadge backpack or an internally hosted version.

This suggests that data pertaining to the following is required: Badges, Objectives and Earned Badges.

Adding A Few Extras

If the objectives required for badges are to be at least based on outcomes of programmes of study (be that at a full degree award level, or one constituent module within a degree), then it may be necessary, or at least preferred, to categorise the objectives within the badging system, or to add types of objectives to the system. Programme outcomes, if taken from our own programme specification documents can be split into at least three different types: Knowledge and understanding; Subject-specific skills and attributes; Transferrable skills and attributes. However, this categorisation of objectives may not hold true for other HEIs that may wish to use this code, and almost certainly would not be applicable if the code was used outside of the education sector. So objective types also have to be stored within the system.

When considering (still within a HE context) how the badging system might be expanded beyond learning outcomes of programmes or modules, you begin to open up the potential of including other data sources into the mix, such as library data, participation with extra curricular activities etc. For this reason, I’ve also included a badge source to the data, so that badges can be awarded from different sources and be differentiated as such through the data and its presentation to users. Again, another group of data to be stored: the source of a badge.

Designing the System

Data Requirements

Firstly, a list of the data required within the system:

  • Objectives for badges
  • Badges
  • Badges earned
  • Source of badges
  • Types of objectives

Doing the whole relational database thing on the data results in a structure something like:

  • Objectives
  • Objective Types
  • Badges
  • Badge-Objective Links
  • Badge Sources
  • Completed Objectives
  • Awarded Badges

A quick Entity Relationship Diagram (including suggested links to possible external data sources) would look something like this:

An Entity Relationship Diagram for a Badge System
ERD for a badge system


Obviously this data structure and suggested ERD is subject to change as I go through the development and prototyping stage.

With a data structure in place, mapping out the flows within the system and designing and implementing the APIs to do the data input and output are the next two steps in the process!

Data & Process Flows

There are several obvious functions that must exist within the system to allow the awarding of open badges to individuals. These functions include:

  1. Storing badge information
  2. Storing objective information
  3. Storing objective types
  4. Linking badges and objectives
  5. Storing various sources of badges
  6. Tracking objective completion for users
  7. Checking badge completion
  8. Storing completed badges for users
  9. Creating assertions for completed badges
  10. Presenting badges to a user through email
  11. Sending badges to a user’s backpack

In order to make the system compatible with existing data sources outside the bounds of the system shown above, the following API functions will need to be externally accessible:

  1. Add badges to the system
  2. Add a new badge source
  3. Add objectives to the system
  4. Add objective types to the system
  5. Uploading a badge image to the server
  6. Mark objectives as completed
  7. Search for existing objectives
  8. View completed badges for a user
  9. View completed objectives for a user
  10. View existing badges
  11. View existing objectives
It should be noted that these lists are only indicative of the functions to be offered by the system and will probably change while I’m developing it.

A quick data flow (ish) diagram shows how the data may flow internally within the system and the data that may be required from external sources, for one of the main series of functions – marking an objectives as being completed, through to awarding the badge to a user.

 What Next?

Firstly, I need to put together a prototype of a system that resembles the one described above. The code will be available on GitHub and licensed appropriately for reuse. Then we need to decide how we *may* go about prototyping the use of the system and any further development that is required. There is no agreement to go beyond the research and prototyping of badges at Lincoln yet and the most likely use case is for awarding badges for extra-curricula achievements, such as participation in workshops and those identified by the Higher Education Achievement Report (HEAR).