Designing a Course Finder Application

Since we now have access to a very large amount of course data, it is possible to look at ways of improving the presentation of, and access to, this data for (for example) potential students. As such, I’m looking at building a prototype ‘Course Finder’ application.

Building on my work that I outlined in my previous post, we can now identify keywords for all of the courses offered at the university. This offers one way that suitable courses that can be identified for users of the application, likely to be potential students. These courses can also be linked to JACs codes, representing the subjects covered by / in the courses. Courses are also delivered at a particular level – foundation degree, bachelors degree, masters etc.

The criteria that I am currently considering using to identify potential courses for users are: subjects previously studied;  subjects interested in and keywords (identified with Open Calais).

As well as using these parameters to produce search results, I have also included features within the application to record ‘click-through’ on search results, as well as the ability to ‘recommend’ a search result as being appropriate and relevant to the search parameters outlined above. As such, the application should ‘learn’ as more and more searches are carried out. If parameters A,B and C are specified and one of the courses recommended as being relevant, then the next time a search is carried out using parameters A,B and C, the same courses should be highlighted as being potentially more useful and relevant to the user.

Database Design

Most of the data required to execute the searches is available from our Academic Programme Management System, through our Nucleus data store. The data relating to the individual search instances, as well as recording click-throughs and recommendations will obviously need to be stored within the application’s database. It may also be necessary to locally store some of the data from Nucleus, in order to improve performance by essentially caching views on the data that are unlikely to change too often, such as links between keywords and courses.

Tables storing data locally include:

  • keyword course links
  • search instances
  • search click-throughs
  • search interests
  • search keywords
  • search studied
  • search recommendations
  • subjects
  • similar courses

The majority of the data stored in the tables listed above relates to Coursefinder-specific functionality, some data has been ‘cached’ from Nucleus, purely to save multiple API calls for data that will change very rarely.

In a follow-up post, I’ll show the created application and describe the benefits and limitations.


Release the Badges!

After working on the badges system that I outlined in a previous post, it has finally reached a point where it is functional enough to be ‘released’. It should be noted, though, that it is neither fully functional ‘out of the box’ and is by no means a shining example of development practices at their best. The mini-project of looking at how a system such as the Mozilla Open Badges platform could be used in higher education has suffered tremendously from scope creep and the underlying code (at the moment) reflects this. Over the past few weeks I’ve been through the following phases:

  • Consider how Open Badges (or similar) could be used in higher education.
  • Create a prototype system to be used in higher education.
  • Develop a more stable system that could be used in a trial run within our university.
  • Develop the system in such a way that it could be picked up and used in a variety of institutions or situations with minimal reconfiguration.

Initially, I considered creating a small database to hold ‘objectives’ that need to be met in order to be awarded badges, along with the bare minimum of APIs in order to interact with the database and the Open Badges framework. After starting out down this path, I started to realise that there was far more potential in a badging system within a higher education institution than I had originally thought and began to think of more features that would be useful.

At this point, I started to develop an application rather than a group of APIs that would provide a far more usable method of managing badges and associated data. After discussions with others around the university and on the open badges mailing lists it seemed that there was potential to use badges (or something similar) to recognise skills developed at university, as well as extra-curricular activities that may form part of the HEAR (Higher Education Achievement Report) or similar. This led to me considering the reuse of any system I developed in other institutions, which altered the way I implemented a few features in the system.

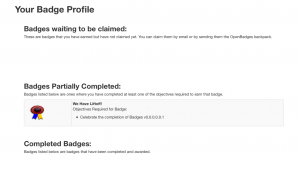
In its current state, the application allows you to login via 2 alternative methods: local registration or via oAuth (which we use at the University of Lincoln). Obviously the oAuth settings would need altering if you were to implement it in this manner in your own institution. Once logged in, admin users (who currently need the admin flag setting manually in the database) are able to create badges, objectives for badges, create a source of badges (could be different departments within an institution) and mark objectives as being complete for a given user or set of users (the application calculates if users are then eligible for the awarding of a badge). When logged in as a ‘standard’ user (although admins can earn badges, too) you are able to see your badge ‘profile’, which shows badges that have been earned and are ready to be claimed, badges that are partially complete (i.e. you have met 1 of 2 objectives for the badge) and badges that have been completed and claimed by you.

Badges that are ready to be claimed can be sent to a backpack (currently beta.openbadges.org) or downloaded as an image, so that they can then be uploaded to another backpack. Badges that have already been sent to a backpack can also be downloaded as images, thus allowing you to add the badge to another backpack if you so wish.

There are still a few features that need to be added to the application and known bugs that need fixing, such as:

  • Feature allowing password reset needs completing
  • The ability for admin users to grant other users administrative privileges
  • A ‘single use’, first-run admin login, thus allowing the initial user to grant admin privileges to somebody. When combined with the previous point this will remove the need for users to manually edit records in the database.
  • There is a known bug with marking objectives as complete for a user ID that has yet to login to the system. Assuming the unique ID of a user is known (currently envisaged as being the staff or student number), objectives can be marked as complete for that user. If the user is eligible for a badge due to the completion of the correct objectives before logging in, the badge currently gets stuck in limbo, as it cannot be awarded as the application does not have the users email address. A simple fix would be to have a “I think i’ve earned this badge” button on the partially completed badges section of the user’s profile.
  • Functions within the code itself need tidying up, because of the amount of scope creep there is likely to be a few functions that are no longer used etc.
  • The user interface needs working on. At the moment ‘it works’.

Here are a few screenshots of the application:

Homepage
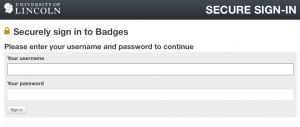
Secure sign on using University of Lincoln oAuth
Badge Profile Screen
Claiming a Badge

The code for the application is available on Github and is released under the GNU Affero General Public License, documentation for the application (such as it is) is also available on Github – I’ll be working on the documentation over the next couple of days. At present there are two branches to the repository: master and develop. The master branch *should* remain stable, while the develop branch will be used to implement the features, and fix the bugs, discussed earlier.

Now that the application is reasonably stable, we’re starting to think of ways that we could trial the application. At the moment it looks like a couple of potential ways are to mimic what may appear in people’s HEAR reports for extra-curricular commitments etc, or perhaps recognizing skills that are developed and presented in non-assessed environments, such as workshops that help develop practical skills etc. However, with the end of the student year fast approaching, it is more likely that I will continue to tinker with and improve elements of the system before trialing it in some form or another from September onwards, with the return of the students.

What to Do with Six Years of Course Data?!?!

After asking colleagues in Planning, I came across some stored reports that contain information about the various awards/courses offered at the university, along with the modules that constitute those awards – from short certificates to full undergraduate and postgraduate degrees. Whilst the reports date back to the 90s, the data within them is substantial enough to be used from 2006-07 onwards; in total this comes to around 50,000 individual award->module relationships spread over the 6 academic years represented in the data.

The first question that arose was: ‘What to do with six years of course data?!?!?!’.

After speaking with Tony Hirst last week, we came to the conclusion that this data would also have a great benefit if utilised in new ways within the university itself, as well as presenting the course information (and related datasets) to current and prospective students. The first way I decided to look at all of this information was to visualise the relationships between modules and courses offered at the university.

The data shows how different awards share certain modules in common; this can be seen in small-scale examples within the raw data itself, but how would the entire dataset for a year look? To find out, I extracted the pertinent information from everything that was currently being stored, and eventually narrowed it down to a set of data that showed the relationships between modules – basically pairs of modules offered on the same awards. Modules formed the nodes of the graph and the links between the nodes – the edges, are representative of the various courses that the modules are offered on.

With this dataset prepared, I loaded the data into Gephi, selected an appropriate layout algorithm and let Gephi work its magic. As a result, we get graphs like this: allmodules_11_12. (Each node is a module, each edge is an award that the module is available on, edge colours represent a single award). From these graphs we can see that clusters of courses form that share many modules in common, mainly around joint degrees (which makes sense!); we can also see that many courses ‘float away’ from these hubs as they are entirely self contained and share no modules with any other award offered at the university. The other graphs can be seen here: all modules 06 07all modules 07 08all modules 08 09all modules 09 10 and all modules 10 11.

So apart from making pretty pictures with course data, what purpose has this served? Well, firstly, I now know that I can get a vast amount of data covering the past six years of course and modules offered at the university. Secondly, I now have a better understanding of the inner workings of Gephi, which will no doubt serve me well over the rest of the project. Thirdly I also now know just who to pester in the right departments to get even more data. Finally…..we now have A0 printouts of these graphs plastered around the office walls – I certainly didn’t envisage using course data as wallpaper when I started on this project.
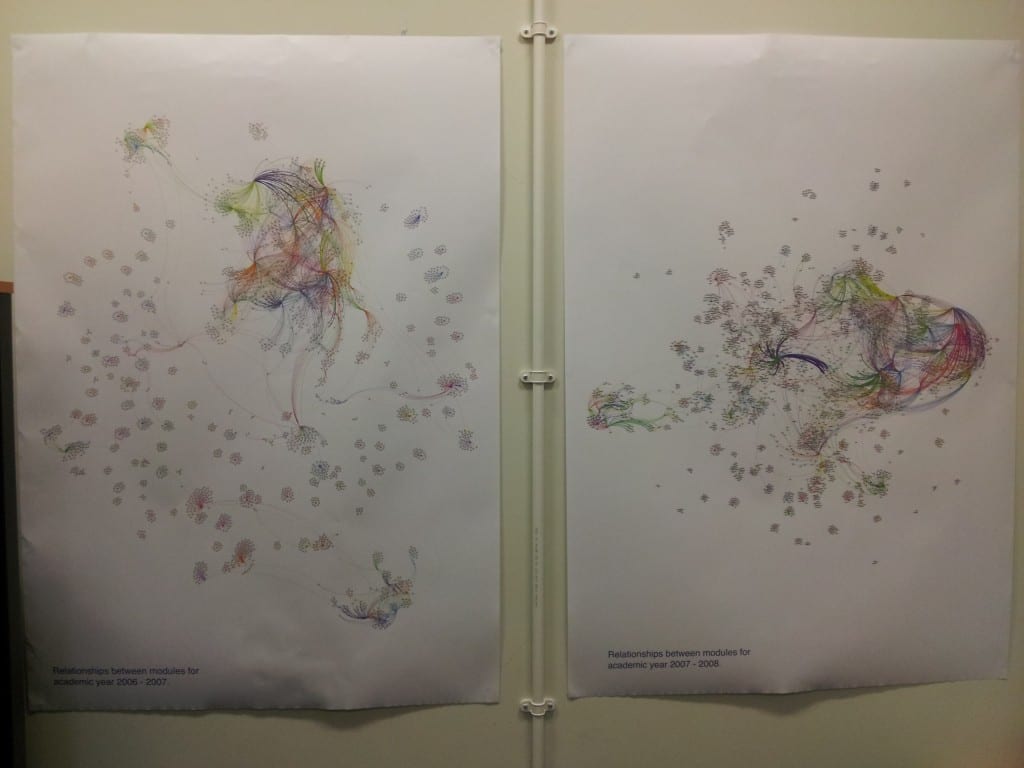
Being able to quickly see the connections between modules, particularly where one module is used for multiple awards could be very useful for those involved in curriculum planning. Obviously I’m not suggesting that they consult one of these A0 posters to assess the impact of changing one module, but being able to quickly find the impact of changing it would be useful. Take for instance, a module that contains an element of group work. 5 courses use this module, 4 of which are run by one particular college, the 5th course is run by a completely separate college. 4 of the courses have far too much group work, it is decided, so the decision is made to remove the group work element from the module. Do those involved in the decision know that the module is used by a course in College B, and, that the module is the only element of group work within a year’s study on the course? Removing the group work element would mean that the course doesn’t contain all of the required elements to be re-validated, obviously causing problems further down the line. Combining the data used to produce the visualisations above, along with other datasources could help to resolve this issue.

So where to go from here? Well, abstracting slightly further from the course->module level, we (I) can start to compare inter-departmental and inter-disciplinary sharing of modules at a department, faculty or college level within the university. Combining with other data that we make available through data.lincoln, we can look at how departments share modules across the physical space of the campuses that make up the university (more on that in another blog post). Combining the data with student numbers, we can look at the subscription levels to the modules that form a focal point to multiple awards. If / when I can get hold of full datasets for learning outcomes & module descriptors, I can start to look at modules that don’t necessarily share any course in common, but may be similar in terms of the learning outcomes they address or the topics they cover (as described in the module descriptions). There really are many ways to combine all of the information that I’m starting to stumble across and it is just a case of finding interesting combinations of datasets and assessing how useful the results are.

As a result of this digging around and tidying up of various data sources, all of the data that can be made accessible through data.lincoln will be made available – in a nice format, unlike the multitude of document types and messy data that I’ve been dealing with recently.

Any suggestions of ways to mash-up some data or ideas about new visualisations, feel free to leave me a comment or three below!